INTRODUCTION
This publication analyses the situation of cocoa in the Republic of Equatorial Guinea from 1996 to 2014. In the decades prior to the discovery of oil in the country, the production and export of cocoa
was the predominant economic activity. Since the beginning of the oil exploitation, the cocoa sector, like other agricultural products, has suffered a strong decrease.
METHODOLOGY
The methodology for the preparation of this publication has been collecting data from the different Equatorial Guinea’s cocoa sector companies and institutions, including:
- Commerce, Agriculture and Forestry Chamber of Bioko
- National Institute of Agricultural Promotion of Equatorial Guinea (INPAGE)
- Casa Mallo S.A. (CAMASA)
In regards to terms of production and export, it should be noted that productions are made by agricultural campaign (December-January of the following year) and are taken according to the relevant years; however the exports are usually identified by campaign production, and start from July to end in March of the following year.
Exports are identified by campaign production, due to not having direct access to the data according to the SNA-1993 rules.
COCOA PRODUCTION
Table 1. Evolution of cocoa production
| COCOA PRODUCTION | AVERAGE GROWTH | |||
|---|---|---|---|---|
| Year | Equatorial Guinea | World | Equatorial Guinea | World |
| 1915 | 3,2 | 1011 | 0,7% | 0,0% |
| 1925 | 8,6 | 1082 | 10,4% | 0,7% |
| 1935 | 14,753 | 1213 | 5,6% | 1,1% |
| 1945 | 26,23 | 1053 | 5,9% | -1,4% |
| 1955 | 35,26 | 1123 | 3,0% | 0,6% |
| 1965 | 43,952 | 1221 | 2,2% | 0,8% |
| 1975 | 10,231 | 1538 | -13,6% | 2,3% |
| 1985 | 2,342 | 1952 | -13,7% | 2,4% |
| 1995 | 3,5 | 2913 | 4,1% | 4,1% |
The production of cocoa before Equatorial Guinea Independence in 1968, experienced relatively higher growth (5%) than the world production (0.4%), between 1915 and 1965 1 , from a few 3.181 tons in 1915 to a higher maximum of 46,000 tons in 1967 what corresponded to the 3% of the world market 2 . While global production continued to grow at significant rates from 1965 to 1995 (+139%) 3 , the activity in the cocoa sector of Equatorial Guinea was suffering continuous decrease in the same period (- 92%).
During this time, factors affecting low domestic production were mainly the lack of labour caused by socio-political conditions developed in the country. After the Independence of Guinea Equatorial and the return of the Spaniards, workers mostly Nigerian were repatriated and the sector never recovered its production status.
Table 2
| COCOA PRODUCTION | ||||
|---|---|---|---|---|
| Cocoa Grade I | Cocoa Grade II | Out of Standard Cocoa | Totals | |
| Year | Tons | Tons | Tons | Tons |
| 1996 | 3523,07 | 1730,58 | 497,34 | 5750,99 |
| 1997 | 2329,48 | 1643,70 | 809,43 | 4782,61 |
| 1998 | 2261,61 | 1329,66 | 765,73 | 4357,00 |
| 1999 | 2341,26 | 1373,85 | 983,37 | 4698,48 |
| 2000 | 2277,44 | 836,04 | 322,13 | 3435,61 |
| 2001 | 1769,84 | 1167,91 | 403,33 | 3341,09 |
| 2002 | 1026,29 | 665,09 | 276,17 | 1967,55 |
| 2003 | 1427,70 | 712,30 | 245,96 | 2385,96 |
| 2004 | 1451,31 | 732,03 | 43,13 | 2226,46 |
| 2005 | 1162,13 | 442,24 | 250,77 | 1855,14 |
| 2006 | 1604,14 | 227,55 | 73,30 | 1904,99 |
| 2007 | 540,09 | 552,03 | 303,39 | 1395,51 |
| 2008 | 734,74 | 295,96 | 57,79 | 1088,50 |
| 2009 | 514,49 | 304,78 | 54,18 | 873,45 |
| 2010 | 716,32 | 31,20 | - | 747,52 |
| 2011 | 583,11 | 111 | 18 | 711,89 |
| 2012 | 482,52 | 117,74 | 21,20 | 621,46 |
| 2013 | 512,61 | 140,14 | 24,96 | 677,71 |
| 2014 | 647,60 | _ | 12,59 | 660,20 |
Source: Commerce, Agricultural and Forestry Chamber of Bioko.
- Source: HHosftra University: La formación del sistema económico colonial en Guinea Ecuatorial, c.1778-1936
- Source: National Institute of Agricultural Promotion of Equatorial Guinea (INPAGE)
- Source:Cocoa International Organization (ICCO)
Today, cocoa is grown on small plots of land worked by advanced age individual farmers, which does not enable them to work in large tracts for the achievement of a harvest in quantity and quality.
Although the Government has a special interest in promoting again the cocoa sector for the sustainability and stimulation of the producers, Equatorial Guinea remains a marginal producer, whose production continues to decrease.
Chart 1. Total production of cocoa in tons (1996-2014)

From 1996 to date, the production of cocoa in Bioko Island has suffered continuous decrease, 1996 and 1997 where higher production years registered reaching the amount of 5.751 and 4.783 tons respectively.
Table 1. Variation of cocoa production (1997-2014)

This trend was worst between 2001 and 2002, presenting a 41.11% fall, decreasing the production of 1.374 tons the previous year.
Strong decreases in production recorded in the years 2001-2002 (see table 1) were due to the reduction of the cultivation area, originated by projects of urban development of the city of Malabo, abandonment of sector rehabilitation programs and the strong floods recorded at that time (see chart 2).
Chart 2. Variation of rainfall and annual production of cocoa (1997-2014)

Source: CAMASA
Elaboration: InegeInege
By contrast, the recovery of production in 2003 (see table 1) was mainly due to an increase of 25% in the subsidy granted by the Government 4 , encouraged by higher export prices. However, losses of previous years could not be compensated by the increase of such incentives. The resulting production amounted to 2,386 tons in that campaign.
Table 3. Relation of crop surface (hectares) and production performance
It should be noted that production has been decreasing in parallel to the area of cultivation and production performance. Since 1968 5 , the surface of cultivation has been reduced drastically through the years, as well the average production performance, with few variations of 94% and 70%, respectively.
| Years | 1968 | 1990 | 2001 |
|---|---|---|---|
| Surface (ha) | 60.000 | 5.960 | 3.456 |
| Performance (kg/ha) | 2.960 | 1.094 | 875 |
4. Source::CAMASA
5. Source: National Institute of Agricultural Promotion of Equatorial Guinea (INPAGE)
Chart 3. Production distribution according to the variety of cocoa (tons).

It is observed in chart 3 that the cocoa type more produced in the country, according to the quality of the grain, is grade I, which represents more than half (60%) of the total production from 1996 to
date. Outside standard cocoa is the least produced, its quantities are very low compared to the other varieties.
The production of cocoa in Equatorial Guinea is in continuous decline in respect to the reported volumes in the past, this is largely due to the national economy focus on the oil sector and the diversification of activities currently carried out by cocoa producers.
Despite many efforts made by the Government to revive the sector in recent decades through cacao plantations 6 improvement programmes (Cacao Plantations Rehabilitation Project (PRC)), Project for the Diversification of Crops and Agricultural Services (DISCA), (1980). Project FED/STABEX (1993-97), Rehabilitation of the cocoa sector and diversification of production, Project for the Reactivation of the Coffee and Cocoa Sectors); the cocoa sector has not been able to recover, mainly due to the absence of labour, abandonment of the farms, as well as the decrease in the surface of cultivation caused by the urbanization of new areas and the widening of the city of Malabo.
6. Source:: National Institute of Agricultural Promotion of Equatorial Guinea (INPAGE).
COCOA EXPORTS
| COCOA EXPORTATIONS | ||||||
|---|---|---|---|---|---|---|
| Cocoa Grade I | Cocoa Grade II | Out of Standard Cocoa | Totals | Totals | ||
| Year | Tons | Tons | Tons | Tons | Million XAF | Destination |
| 1996 | 3447,87 | 1693,29 | 674,09 | 5815,25 | 3599,33 | SPAIN |
| 1997 | 2167,55 | 1619,49 | 813,24 | 4600,28 | 3479,18 | SPAIN AND NETHERLANDS |
| 1998 | 2060,94 | 1137,88 | 689,55 | 3888,37 | 3629,46 | SPAIN AND NETHERLANDS |
| 1999 | 2489,72 | 1535,92 | 1011,71 | 5037,34 | 3451,18 | SPAIN AND NETHERLANDS |
| 2000 | 497,40 | 728,70 | 364,66 | 2590,76 | 1439,58 | SPAIN AND NETHERLANDS |
| 2001 | 2603,46 | 1232,70 | 448,13 | 4284,29 | 2958,64 | SPAIN AND NETHERLANDS |
| 2002 | 1119,64 | 790,05 | 417,00 | 2326,70 | 2154,77 | SPAIN AND NETHERLANDS |
| 2003 | 1411,92 | 738,41 | 203,27 | 2353,60 | 2343,54 | SPAIN AND NETHERLANDS |
| 2004 | 1234,46 | 529,34 | 70,19 | 1833,98 | 1314,04 | SPAIN AND NETHERLANDS |
| 2005 | 1199,80 | 461,39 | 95,00 | 1756,19 | 1107,80 | SPAIN |
| 2006 | 1661,93 | 504,73 | 217,34 | 2384,00 | 1439,84 | SPAIN |
| 2007 | 379,66 | 60,53 | 217,38 | 657,57 | 394,73 | SPAIN |
| 2008 | 851,10 | 602,24 | 143,10 | 1596,44 | 1140,94 | SPAIN |
| 2009 | 794,95 | 386,01 | 57,79 | 1238,75 | 939,85 | SPAIN |
| 2010 | 582,29 | 155,63 | 54,18 | 792,10 | 696,50 | SPAIN |
| 2011 | 528,56 | _ | _ | 528,56 | 555,67 | SPAIN |
| 2012 | 656,60 | 188,26 | 18,27 | 863,14 | 807,96 | SPAIN |
| 2013 | 387,40 | 120,13 | 21,20 | 528,74 | 506,61 | SPAIN |
| 2014 | 583,88 | 60,00 | 24,96 | 668,84 | 753,06 | SPAIN |
Source::Commerce, Agriculture and Forestry Chamber of Bioko.
COCOA EXPORTS (1996-2014)

The general evolution of exports shows different ups and downs experienced by the sector of cocoa over the years, between 1999 and 2000 a 48.57%, fall in volume was registered, then again growth was experienced in 2001 with a 65.37% variation, decreasing in 2002 (45.69%). The greatest variation of exports (142.78%) was obtained between 2007 and 2008.
Chart 2. Cocoa exports variations (1997-2014).

In Equatorial Guinea, in terms of traded volume, revenues from cocoa exports have decreased in parallel to national production. In recent years, the price of cocoa has been the decisive factor that has preserved
exports revenues; behaviour associated with the growing trend of prices of cocoa in the international market experienced lately .
Chart 5. Variation in export prices according to varieties (Million XAF/Ton).
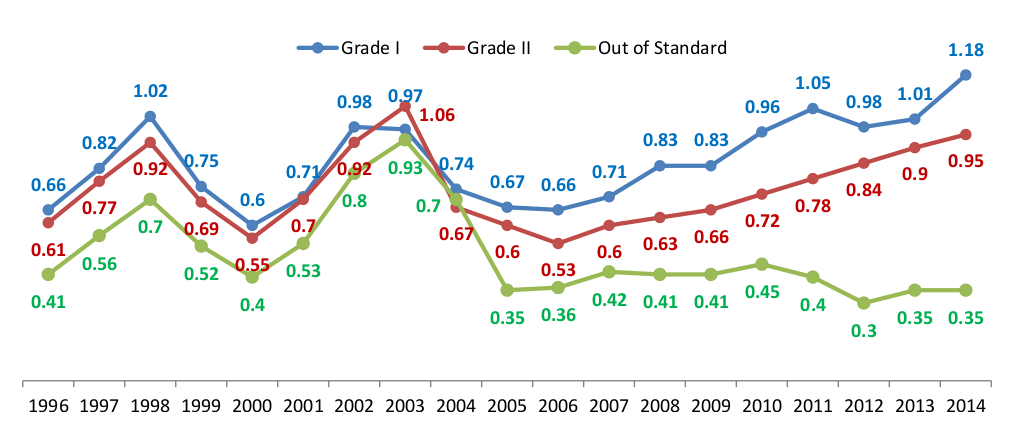
In regards to the varieties of cocoa, cocoa grade I has experienced higher prices along the period, contrary to what happened with out of standard cocoa, which registered lower prices. Years 1998, 2002 and 2003 recorded prices higher than average: 0.88 and 0.90 and 0.99 (Million XAF/tons) respectively.
The minor difference in prices between the three types of cocoa is obtained in 2004. It is important to note that in 1998 the price behaviour for the three varieties was identical, what presents a
variation of 25.5% compared to the previous year price.
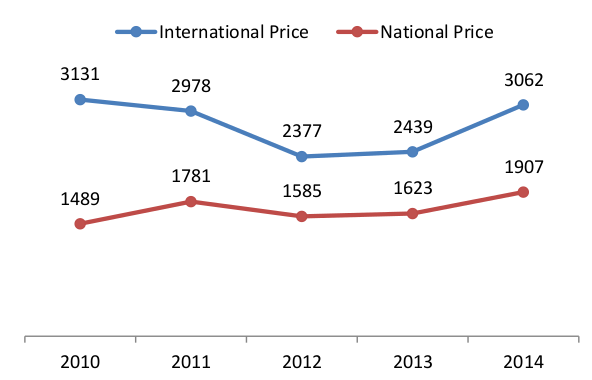
Chart 6. Evolution of national and international cocoa prices (U$D/Ton)
7. Source : ICCO, INPAGE
International cocoa 7 prices depend on the world market behaviour, determined by the law of supply and demand, and are affected by London and New York stock exchanges.
In Equatorial Guinea, local price of cocoa is regulated by the Government, which sets prices through INPAGE. Exports are set by international price.
WORLD COCOA MARKET
World trade of primary products, including cocoa beans, is of significant importance as the production and export of these products, are basis of the economy of the majority of developing countries.
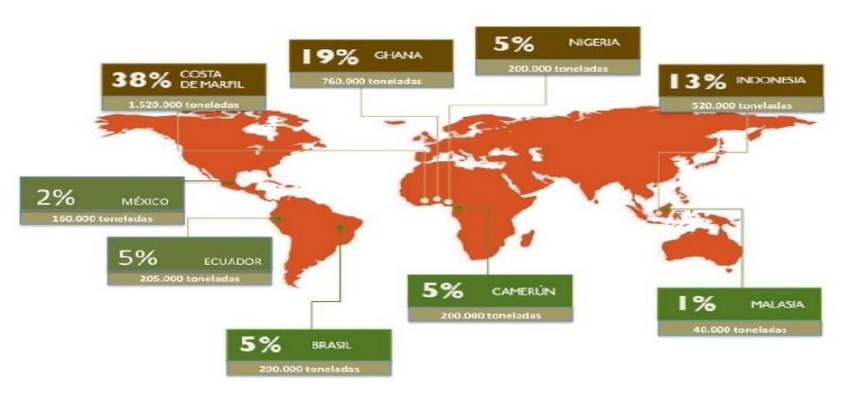
Source:: ICCO
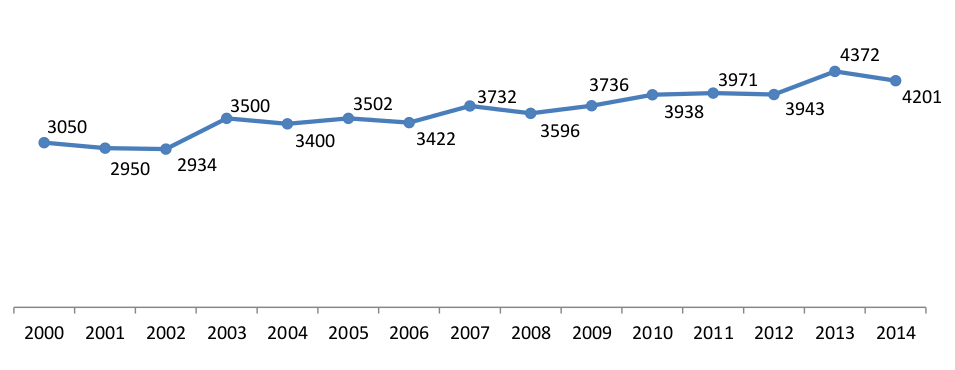
In terms of world production share, Africa remains the largest producing region of cocoa, with more than 71% of world production in 2013-2014.
At international level, consumption of products derived from cocoa are in continuous growth (+17% between 2000 and 2009) and is increasingly concentrated in Europe (49%) and America (33%). Between 2013 and 2014, world cocoa consumption was around 4 million tons 8 .
Equatorial Guinea is characterized as a cocoa-exporting country. The totality of its production is aimed at exports, due to the lack of a local cocoa processing industry. It should be noted that the country has a “unique” experience of artisan processing of cacao, whose trade volume is inconsiderate.
8. Source:: ICCO
Chart 7. Evolution of world cocoa production (Thousands of tons).
Source : ICCO
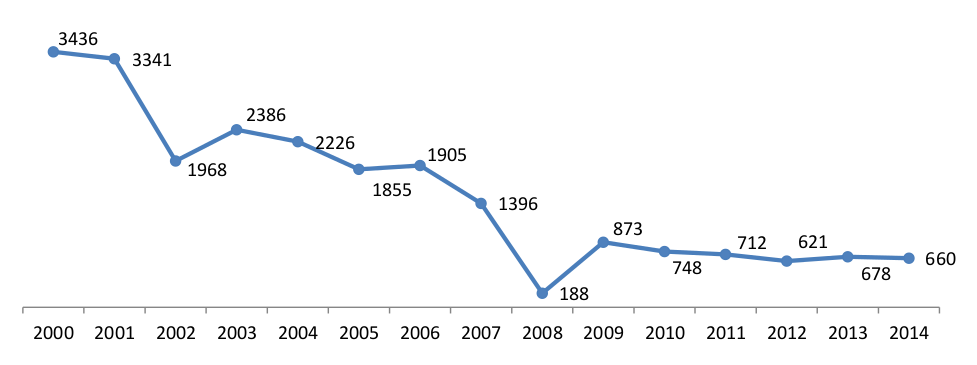
Chart 8. Evolution of national cocoa production (Tons).
Source: Commerce, Agriculture and Forestry Chamber of Bioko.
As graphs 7 and 8 show, as world production grows from year 2000, domestic production decreases over the same period.
As per main exports destinations, it should be noted that in the last 10 years all exports have been shipped to Spain (see table 4).
CONCLUSION
The production of cocoa has declined significantly in recent years due to the focus of national economy on the oil sector, lack of labour and the decrease of the cultivation areas since the beginning of year 2000, due to the new area developments.
The main producing company is transitioning from the exclusive cultivation of cocoa to the provision of other services, diversifying this way its activities.
Internationally, world cocoa market prospects are very promising for the next few years, as both supply and demand as well as international price are in continuous growth.
In this international cocoa market favourable context, it should be noted that it represents a potential sector for diversification of the economy of Equatorial Guinea, in the framework of Equatorial Guinea’s National Plan for Economic and Social Development 2020.

Address: Edificio Abayak, 4a Planta, Malabo II,
Phone: +240 222 19067 24
Website: www.inege.gq
